

Data Analytics (Business Intelligence)
Business insights with Microsoft Power BI
Understandable. Convenient. Up-to-date.

BI App
Build with Power BI
Business intelligence and analytics from Microsoft Power BI can be customized, extended, and embedded in applications using our comprehensive set of APIs and fully documented SDK libraries.
As business processes become more and more digitalized, increasing volumes of data are generated. The resultant flow of data also expands
in both volume and velocity. It gets harder and harder to convert that data into the information and knowledge to support quality
decision-making.
Your company’s data is stored in multiple locations, including central line of business software, countless Excel spreadsheets and other data sources e.g. data streams, cloud services etc. The challenge is finding a way to deal with that data, and to turn it into value.
Power BI is a cloud-based Business Intelligence solution from Microsoft. It delivers analyses views and reports by aggregating data from a wide range of sources and presents it in a meaningful manner. Easy-to-read dashboards, with clearly understandable, easy to act-on data visualization based on up-to-the-minute data, provide quick insight and can be shared with anyone you choose.
Power BI, being a Microsoft product, can connect seamlessly with your ENWIS or Dynamics 365 Business Central based business software, integrating simply with your business data.
Drag-and-drop capability and an intuitive user interface let you display whatever business data you want at the touch of a button. In addition, 8 templates are available for your ENWIS business solution, with industry-specific sample reports out of the box.
Your company has vast quantities of important information and data. Most of this data is stored in your sector-specific Microsoft Dynamics 365 Business Central solution, in Excel tables or in other data sources (streaming data, cloud services etc.). Power BI by Microsoft makes convenient organisation and integration of all your data from various sources possible.
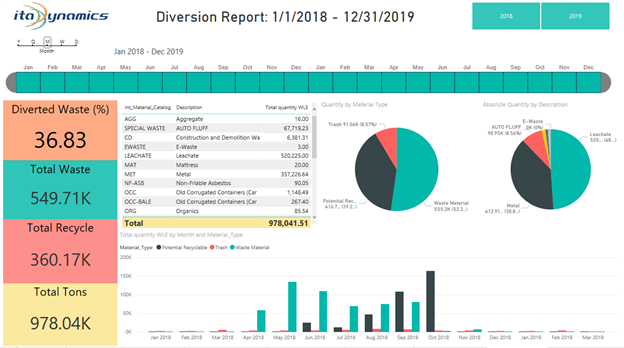
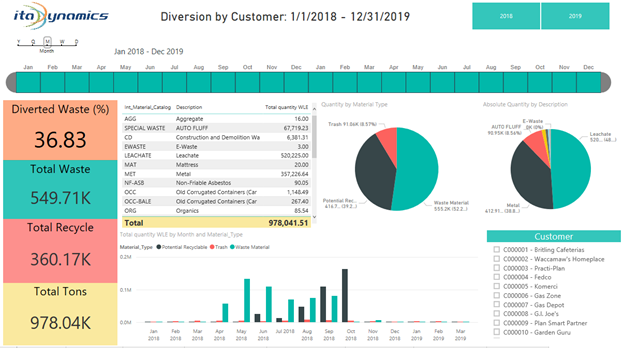
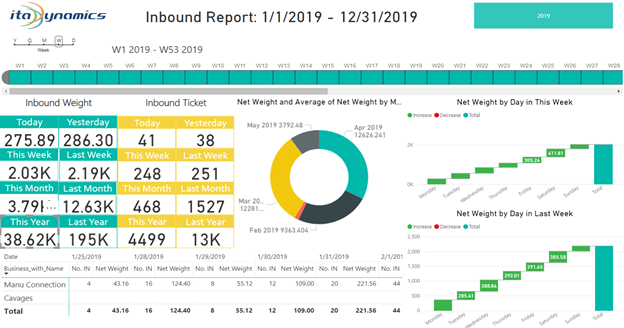
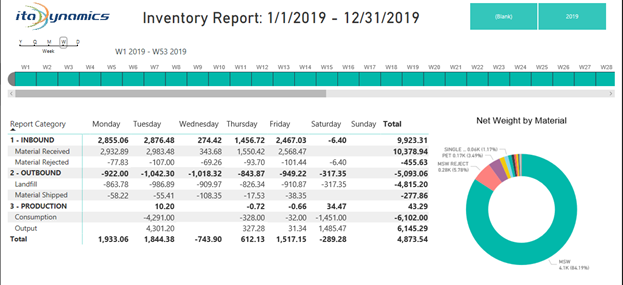
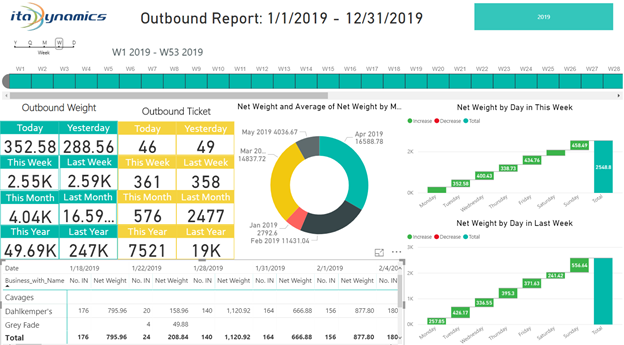
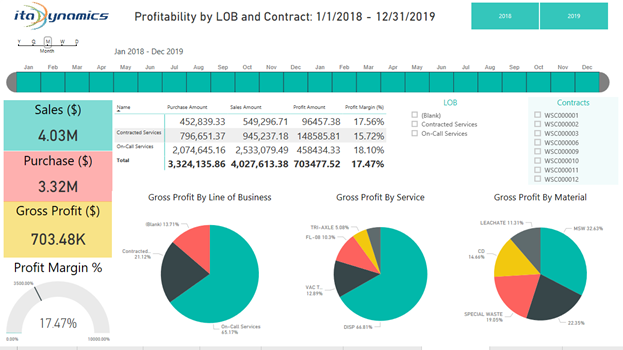
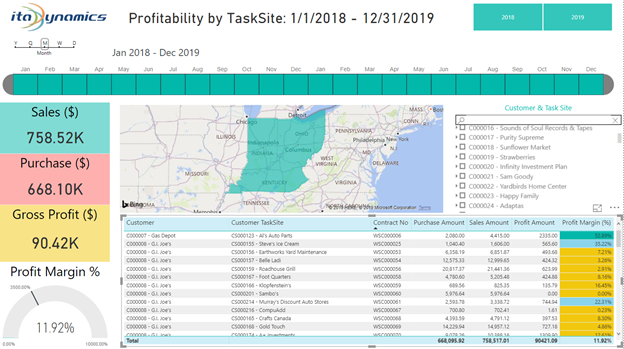
CONVINCING DATA DASHBOARDS
Clear dashboards featuring easy-to-understand, activity-relevant data visualizations allow you to benefit from decisive insights based on daily updated data.
REPORTS AS YOU NEED THEM
Using drag and drop and thanks to the intuitive user interface you can visualize business data according to your wishes: with reliable aggregated data for better decision-making.
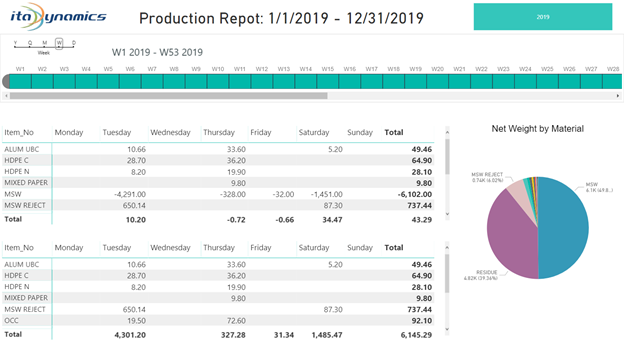
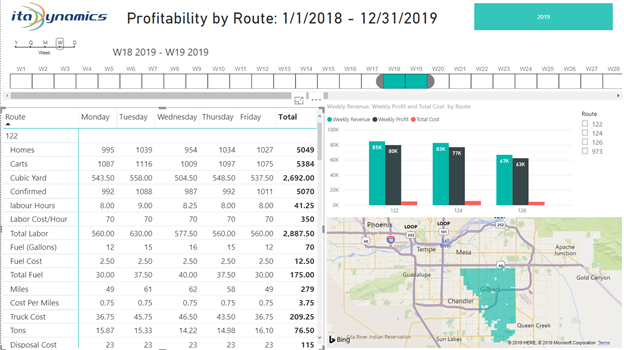
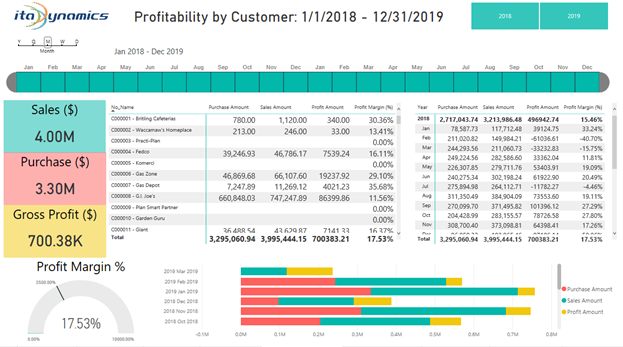
SECTOR-SPECIFIC EXAMPLE REPORTS
Our ENWIS product includes ten free of charge templates as well as sector-specific example reports, which you can make use of straight away.
Individual data visualization with updated daily data Import data from various sources Access all your data via desktop, tablet and smartphone – anytime, anywhere. Share important findings via e-mail, links or Excel integration Templates with example reports in ENWIS.
Your company’s data is stored in multiple locations, including central line of business software, countless Excel spreadsheets and other data sources e.g. data streams, cloud services etc. The challenge is finding a way to deal with that data, and to turn it into value.
Power BI is a cloud-based Business Intelligence solution from Microsoft. It delivers analyses views and reports by aggregating data from a wide range of sources and presents it in a meaningful manner. Easy-to-read dashboards, with clearly understandable, easy to act-on data visualization based on up-to-the-minute data, provide quick insight and can be shared with anyone you choose.
Power BI, being a Microsoft product, can connect seamlessly with your ENWIS or Dynamics 365 Business Central based business software, integrating simply with your business data.
Drag-and-drop capability and an intuitive user interface let you display whatever business data you want at the touch of a button. In addition, 8 templates are available for your ENWIS business solution, with industry-specific sample reports out of the box.
Your company has vast quantities of important information and data. Most of this data is stored in your sector-specific Microsoft Dynamics 365 Business Central solution, in Excel tables or in other data sources (streaming data, cloud services etc.). Power BI by Microsoft makes convenient organisation and integration of all your data from various sources possible.
CONVINCING DATA DASHBOARDS
Clear dashboards featuring easy-to-understand, activity-relevant data visualizations allow you to benefit from decisive insights based on daily updated data.
REPORTS AS YOU NEED THEM
Using drag and drop and thanks to the intuitive user interface you can visualize business data according to your wishes: with reliable aggregated data for better decision-making.
SECTOR-SPECIFIC EXAMPLE REPORTS
Our ENWIS product includes ten free of charge templates as well as sector-specific example reports, which you can make use of straight away.
Individual data visualization with updated daily data Import data from various sources Access all your data via desktop, tablet and smartphone – anytime, anywhere. Share important findings via e-mail, links or Excel integration Templates with example reports in ENWIS.